186.833 Visualisierung 2 VU SS 2015 VU 3.0 h (4.5 ECTS)
Arc diagrams: visualizing structure in strings
Matthias Gusenbauer, David Pfahler
1125577, 1126287
The arc diagramm
The arc diagram is a visualization method to represent patterns of repetition in data that can be represented as a string developed by Martin Wattenberg. The repeating substrings get connected with an arc. Showing all possible arcs for repetitions in strings would be a visual overload and therefore only a subset of all possible arcs gets shown. In general two types of matching pairs are defined. The maximal matching pair and the essential matching pair.
The maximal matching pair (X, Y) of substring S has the following properties:
Identical - X and Y consist of the same sequence of symbols.
Non-overlapping - X and Y do not intersect.
Consecutive- X occurs before Y, and there is no substring Z, identical to X and Y, whose beginning falls between the beginning of X and the beginning of Y.
Maximal - No identical non-overlapping subsequences X′ and Y′ with X′ containing X and Y′ containing Y′ exists.
The second type, the essential matching pair, is a pair of substrings of S, X and Y and it is based upon the following rules:
A maximal matching pair not contained in any repetition region.
Or, a maximal matching pair contained in the same fundamental substring of any repetition region that contains it,
Or, two consecutive fundamental substrings for a repetition region.
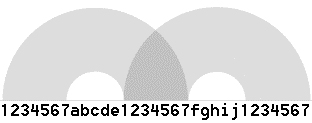
In order to draw the arc diagrams the string S of length N has to be mapped to the x-axis where ($\frac{m}{N}, 0$) corresponds to the m-th symbol on the axis. Mapped to an axis a substring T of the complete string S can be considered an interval on the x-axis. (X, Y), an essential matching pair, where X as well as Y are an interval on the axis, an arc can be created by drawing a half circular arc from X to Y. An example of such mapping can be seen in Figure 1.
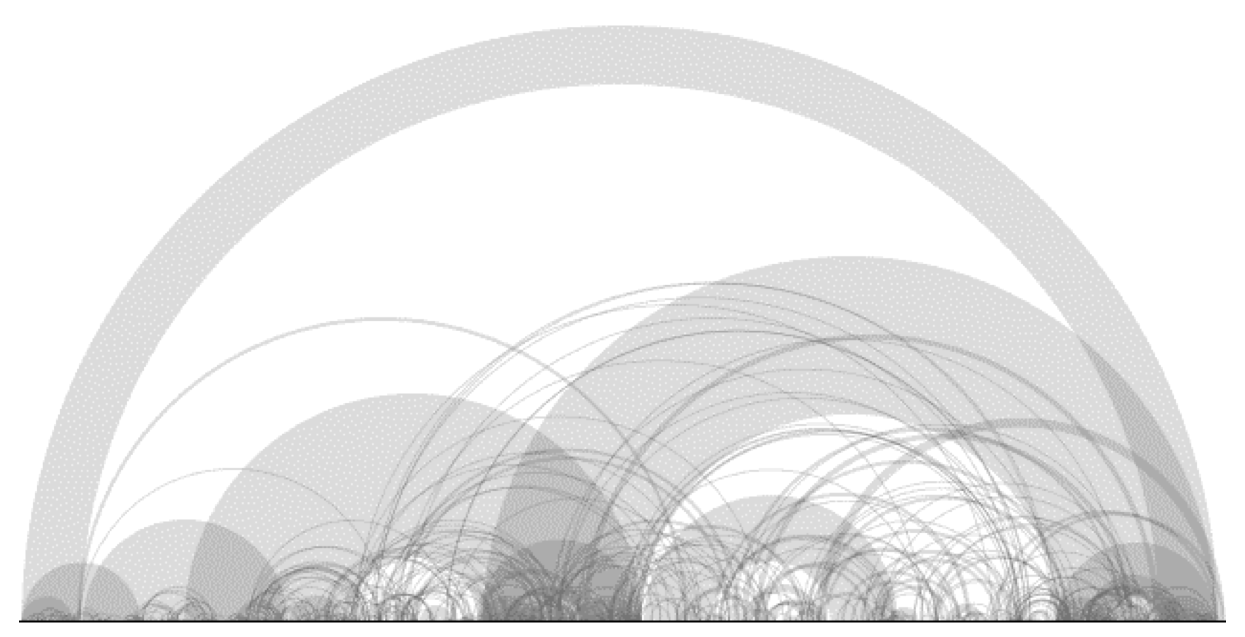
As mentioned at the beginning of Section [sec:arcdiagexp] arc diagrams are ideal to detect patterns in information that can be represented as a string. An increasingly complex example can be seen in Figure 2 which depicts the arc diagram for Beethoven’s “Für Elise”. Two major patterns can be easily spotted using this form of visualization. The first pattern is visible as the arc spanning from the beginning to the end, which shows that this musical piece starts and ends with the same melody. The second perceivable pattern can be seen as the arcs spanning from the beginning to the end of the string S with increasing height and multiple intermediate steps. This means that the melody at the beginning is repeated, as a longer version, several times during the play.

A substring repeated three times

A more complex example: arc diagram of Für Elise
Implementation
We want to implement the arc diagram as a web application.
Technologies
The following technologies are going to be used:
Data-Driven Documents: A JavaScript library for manipulating documents based on data.
jQuery: A fast, small, and feature-rich JavaScript library.
Bootstrap: Framework for developing responsive, mobile first projects on the web.
Interface and interaction
The user should be able to:
Look at the beautiful visualization.
Enter a string into a textbox which then should get displayed as an arc diagram.
Upload a file as input
Point at a particular arc which fades out every other arc and displays the corresponding subsequence.
Use a slider to control the level of detail.
Motivation
We want to implement the arc diagram to contribute to the D3 gallery where the arc diagram is on the wish list https://github.com/mbostock/d3/wiki/Gallery#wish-list