Speaker: Marwin Schindler
Advances in measurement technologies and 3D vision have significantly enhanced the speed and precision with which real-world objects and landscapes can be captured and reconstructed. These virtual reconstructions are relevant for surveying applications and are frequently encoded as point clouds. Often, reconstructions of objects or landscapes are acquired over time to monitor their changes. Intuitive visualization that allows one to comprehend the shifts over time in such reconstructions could be of help, but the vast size of the data imposes challenges on comparative visualization pipelines. Outside of computationally intensive algorithms tailored to applications for the medical domain, there is a gap in approaches that allow for comparing differences within ensembles of shapes.
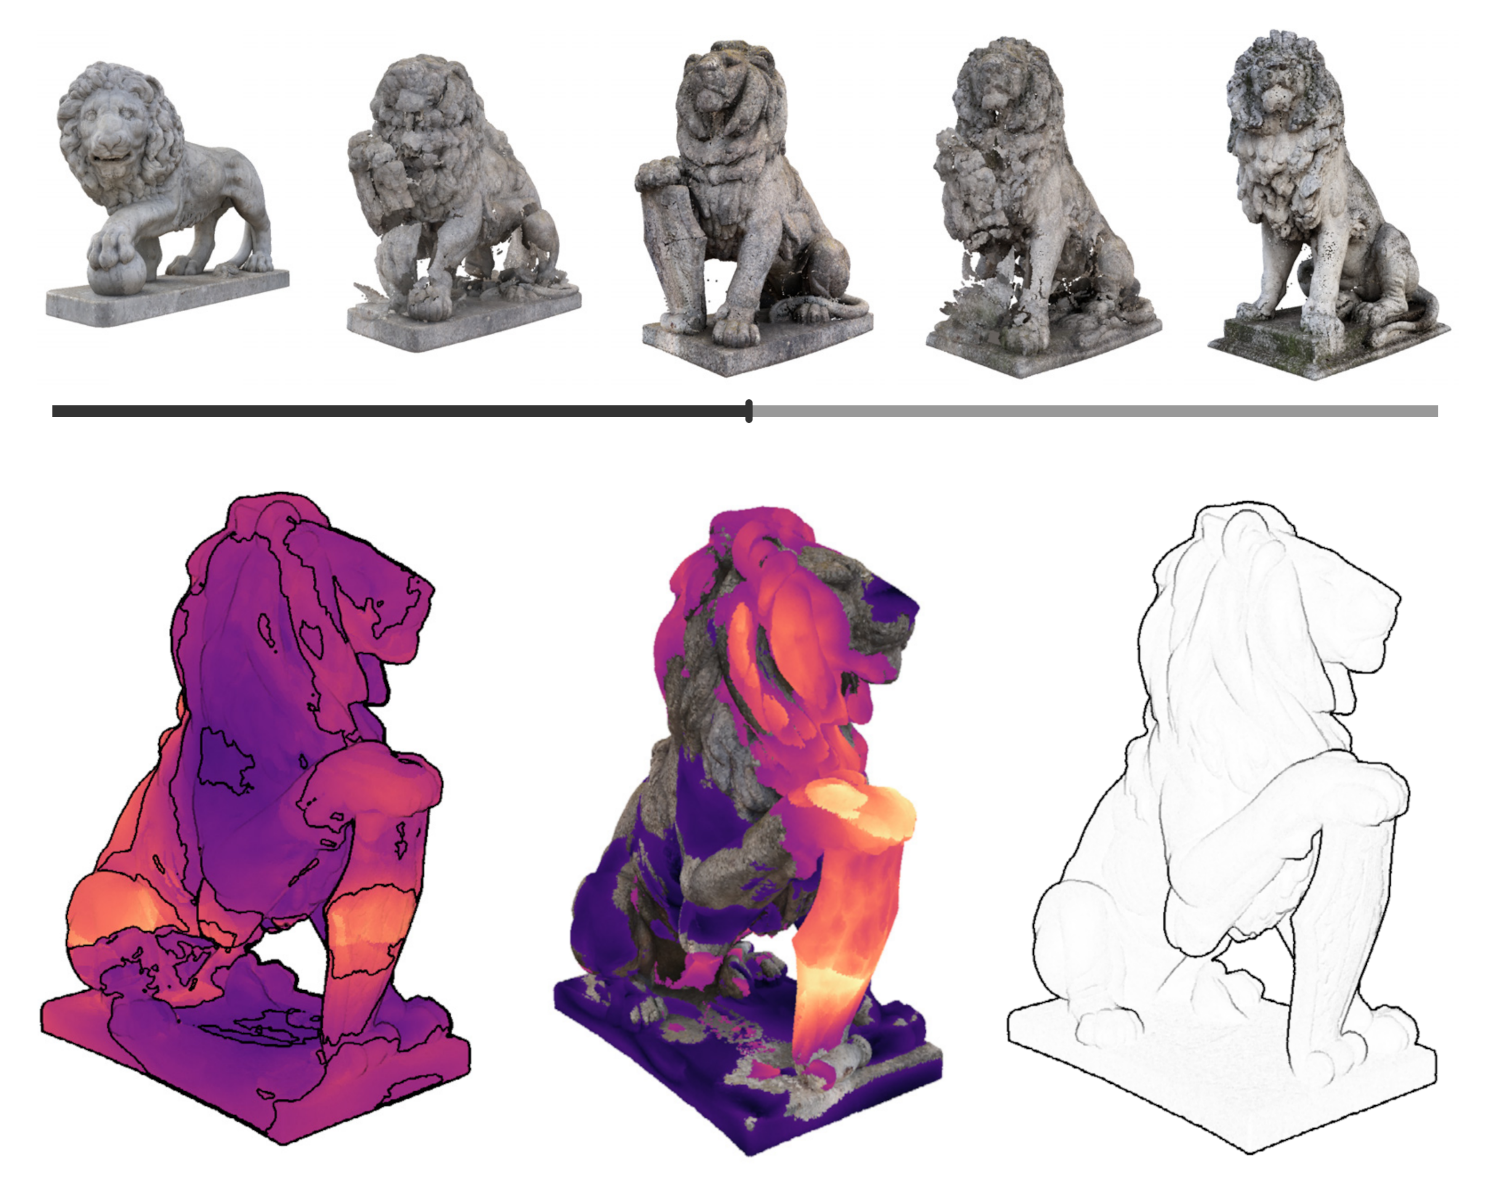
We designed and implemented a framework to support the comparative visualization of ensembles of point clouds. By utilizing the mature mathematical framework of optimal transport, we circumvent shortcomings of commonly employed nearest neighbor-based approaches and allow our method to compare a whole ensemble of reconstructions in a comprehensive representation. If there is no inherent ordering, our method enables the automatic arrangement of individual point clouds, establishing their relationships and simplifying the analysis process. We derive additional metrics about the whole ensemble, which are then used to enrich the visualization and help to detect patterns of variation within the data. We enable a smooth transition between displayed point clouds in an animation and offer visual aids that highlight the characteristics of each shape and how these change. Our method processes the data fast and provides comprehensive means to browse through a large ensemble of point clouds.